Alerts (FREE)
Alerts are a critical entity in your incident management workflow. They represent a notable event that might indicate a service outage or disruption. GitLab provides a list view for triage and detail view for deeper investigation of what happened.
Alert List
Users with at least Developer permissions can access the Alert list at Monitor > Alerts in your project's sidebar. The Alert list displays alerts sorted by start time, but you can change the sort order by clicking the headers in the Alert list. (Introduced in GitLab 13.1.)
The alert list displays the following information:
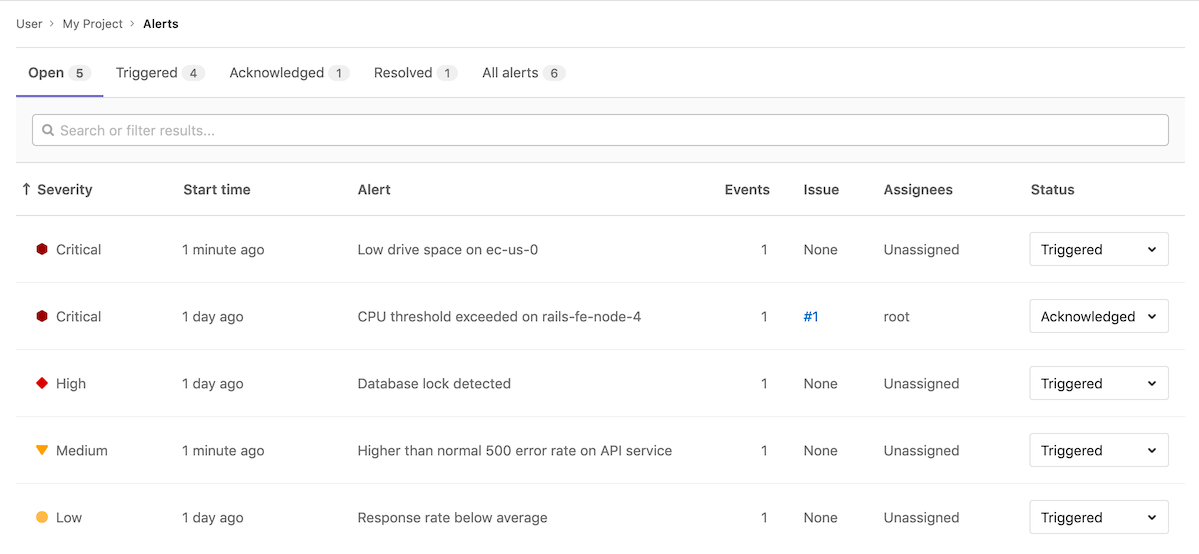
- Search: The alert list supports a simple free text search on the title, description, monitoring tool, and service fields. (Introduced in GitLab 13.1.)
- Severity: The current importance of a alert and how much attention it should receive. For a listing of all statuses, read Alert Management severity.
-
Start time: How long ago the alert fired. This field uses the standard
GitLab pattern of
X time ago, but is supported by a granular date/time tooltip depending on the user's locale. - Alert description: The description of the alert, which attempts to capture the most meaningful data.
- Event count: The number of times that an alert has fired.
- Issue: A link to the incident issue that has been created for the alert.
-
Status: The current status of the alert:
- Triggered: Investigation has not started.
- Acknowledged: Someone is actively investigating the problem.
- Resolved: No further work is required.
- Ignored: No action will be taken on the alert.
NOTE:
Check out a live example available from the
tanuki-inc project page
in GitLab to examine alerts in action.
Alert severity
Each level of alert contains a uniquely shaped and color-coded icon to help you identify the severity of a particular alert. These severity icons help you immediately identify which alerts you should prioritize investigating:

Alerts contain one of the following icons:
| Severity | Icon | Color (hexadecimal) |
|---|---|---|
| Critical | {severity-critical} | #8b2615 |
| High | {severity-high} | #c0341d |
| Medium | {severity-medium} | #fca429 |
| Low | {severity-low} | #fdbc60 |
| Info | {severity-info} | #418cd8 |
| Unknown | {severity-unknown} | #bababa |
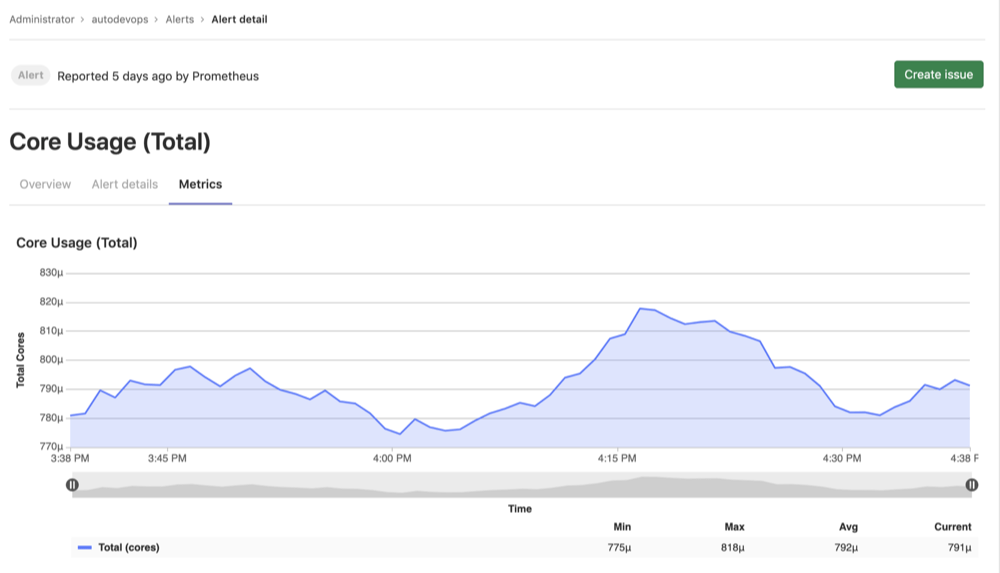
Alert details page
Navigate to the Alert details view by visiting the Alert list and selecting an alert from the list. You need least Developer permissions to access alerts.
NOTE: To review live examples of GitLab alerts, visit the alert list for this demo project. Select any alert in the list to examine its alert details page.
Alerts provide Overview and Alert details tabs to give you the right amount of information you need.
Alert details tab
The Alert details tab has two sections. The top section provides a short list of critical details such as the severity, start time, number of events, and originating monitoring tool. The second section displays the full alert payload.
Metrics tab
Introduced in GitLab 13.2.
The Metrics tab displays a metrics chart for alerts coming from Prometheus. If the alert originated from any other tool, the Metrics tab is empty. To set up alerts for GitLab-managed Prometheus instances, see Managed Prometheus instances. For externally-managed Prometheus instances, you must configure your alerting rules to display a chart in the alert. For information about how to configure your alerting rules, see Embedding metrics based on alerts in incident issues. See External Prometheus instances for information about setting up alerts for your self-managed Prometheus instance.
To view the metrics for an alert:
- Sign in as a user with Developer or higher permissions.
- Navigate to Monitor > Alerts.
- Select the alert you want to view.
- Below the title of the alert, select the Metrics tab.
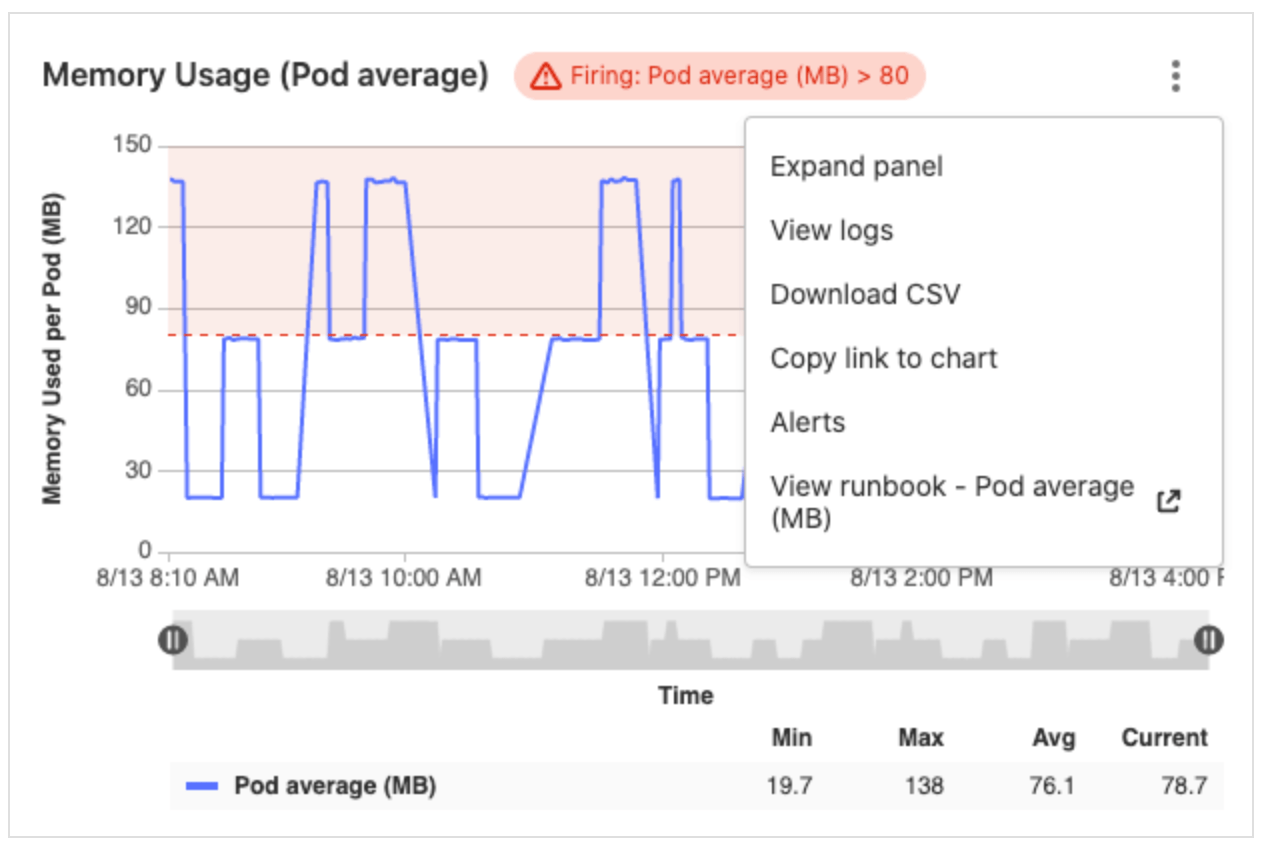
View an alert's logs
- Introduced in GitLab Ultimate 12.8.
- Improved in GitLab 13.3.
- Moved to GitLab Free 12.9.
Viewing logs from a metrics panel can be useful if you're triaging an application incident and need to explore logs from across your application. These logs help you understand what's affecting your application's performance and how to resolve any problems.
To view the logs for an alert:
- Sign in as a user with Developer or higher permissions.
- Navigate to Monitor > Alerts.
- Select the alert you want to view.
- Below the title of the alert, select the Metrics tab.
- Select the menu of the metric chart to view options.
- Select View logs.
Activity feed tab
Introduced in GitLab 13.1.
The Activity feed tab is a log of activity on the alert. When you take action on an alert, this is logged as a system note. This gives you a linear timeline of the alert's investigation and assignment history.
The following actions result in a system note:
- Updating the status of an alert
- Creating an incident based on an alert
- Assignment of an alert to a user

Alert actions
There are different actions available in GitLab to help triage and respond to alerts.
Update an alert's status
The Alert detail view enables you to update the Alert Status. See Create and manage alerts in GitLab for more details.
Create an incident from an alert
Introduced in GitLab 13.1.
The Alert detail view enables you to create an issue with a description populated from an alert. To create the issue, select the Create Issue button. You can then view the issue from the alert by selecting the View Issue button.
Closing a GitLab issue associated with an alert changes the alert's status to Resolved. See Create and manage alerts in GitLab for more details about alert statuses.
Assign an alert
Introduced in GitLab 13.1.
In large teams, where there is shared ownership of an alert, it can be difficult to track who is investigating and working on it. Assigning alerts eases collaboration and delegation by indicating which user is owning the alert. GitLab supports only a single assignee per alert.
To assign an alert:
-
To display the list of current alerts, navigate to Monitor > Alerts.
-
Select your desired alert to display its details.

-
If the right sidebar is not expanded, select {angle-double-right} Expand sidebar to expand it.
-
In the right sidebar, locate the Assignee, and then select Edit. From the dropdown menu, select each user you want to assign to the alert. GitLab creates a to-do item for each user.

After completing their portion of investigating or fixing the alert, users can unassign themselves from the alert. To remove an assignee, select Edit next to the Assignee dropdown menu and deselect the user from the list of assignees, or select Unassigned.
Create a to-do item from an alert
Introduced in GitLab 13.1.
You can manually create To-Do list items for yourself from the Alert details screen, and view them later on your To-Do List. To add a to-do item:
-
To display the list of current alerts, navigate to Monitor > Alerts.
-
Select your desired alert to display its Alert Management Details View.
-
Select the Add a to do button in the right sidebar:

Select the To-Do List {todo-done} in the navigation bar to view your current to-do list.
Link runbooks to alerts
Runbook URLs introduced in GitLab 13.3.
When creating alerts from the metrics dashboard for managed Prometheus instances, you can link a runbook. When the alert triggers, you can access the runbook through the chart context menu in the upper-right corner of the metrics chart, making it easy for you to locate and access the correct runbook:
View the environment that generated the alert
- Introduced in GitLab 13.5 behind a feature flag, disabled by default.
- Enabled by default in GitLab 13.6.
WARNING: This feature might not be available to you. Check the version history note above for details.
The environment information and the link are displayed in the Alert Details tab.