Profiling
To make it easier to track down performance problems GitLab comes with a set of profiling tools, some of these are available by default while others need to be explicitly enabled.
Profiling a URL
There is a Gitlab::Profiler.profile method, and corresponding
bin/profile-url script, that enable profiling a GET or POST request to a
specific URL, either as an anonymous user (the default) or as a specific user.
The first argument to the profiler is either a full URL (including the instance hostname) or an absolute path, including the leading slash.
When using the script, command-line documentation is available by passing no arguments.
When using the method in an interactive console session, any changes to the application code within that console session is reflected in the profiler output.
For example:
Gitlab::Profiler.profile('/my-user')
# Returns a RubyProf::Profile for the regular operation of this request
class UsersController; def show; sleep 100; end; end
Gitlab::Profiler.profile('/my-user')
# Returns a RubyProf::Profile where 100 seconds is spent in UsersController#show
For routes that require authorization you must provide a user to
Gitlab::Profiler. You can do this like so:
Gitlab::Profiler.profile('/gitlab-org/gitlab-test', user: User.first)Passing a logger: keyword argument to Gitlab::Profiler.profile sends
ActiveRecord and ActionController log output to that logger. Further options are
documented with the method source.
Gitlab::Profiler.profile('/gitlab-org/gitlab-test', user: User.first, logger: Logger.new($stdout))There is also a RubyProf printer available:
Gitlab::Profiler::TotalTimeFlatPrinter. This acts like
RubyProf::FlatPrinter, but its min_percent option works on the method's
total time, not its self time. (This is because we often spend most of our time
in library code, but this comes from calls in our application.) It also offers a
max_percent option to help filter out outer calls that aren't useful (like
ActionDispatch::Integration::Session#process).
There is a convenience method for using this,
Gitlab::Profiler.print_by_total_time:
result = Gitlab::Profiler.profile('/my-user')
Gitlab::Profiler.print_by_total_time(result, max_percent: 60, min_percent: 2)
# Measure Mode: wall_time
# Thread ID: 70005223698240
# Fiber ID: 70004894952580
# Total: 1.768912
# Sort by: total_time
#
#  %self      total      self      wait     child     calls  name
#   0.00      1.017     0.000     0.000     1.017       14  *ActionView::Helpers::RenderingHelper#render
#   0.00      1.017     0.000     0.000     1.017       14  *ActionView::Renderer#render_partial
#   0.00      1.017     0.000     0.000     1.017       14  *ActionView::PartialRenderer#render
#   0.00      1.007     0.000     0.000     1.007       14  *ActionView::PartialRenderer#render_partial
#   0.00      0.930     0.000     0.000     0.930       14   Hamlit::TemplateHandler#call
#   0.00      0.928     0.000     0.000     0.928       14   Temple::Engine#call
#   0.02      0.865     0.000     0.000     0.864      638  *Enumerable#inject
To print the profile in HTML format, use the following example:
result = Gitlab::Profiler.profile('/my-user')

printer = RubyProf::CallStackPrinter.new(result)
printer.print(File.open('/tmp/profile.html', 'w'))
GitLab-Profiler is a project that builds on this to add some additional niceties, such as allowing configuration with a single YAML file for multiple URLs, and uploading of the profile and log output to S3.
Speedscope flamegraphs
You can generate a flamegraph for a particular URL by adding the performance_bar=flamegraph parameter to the request.
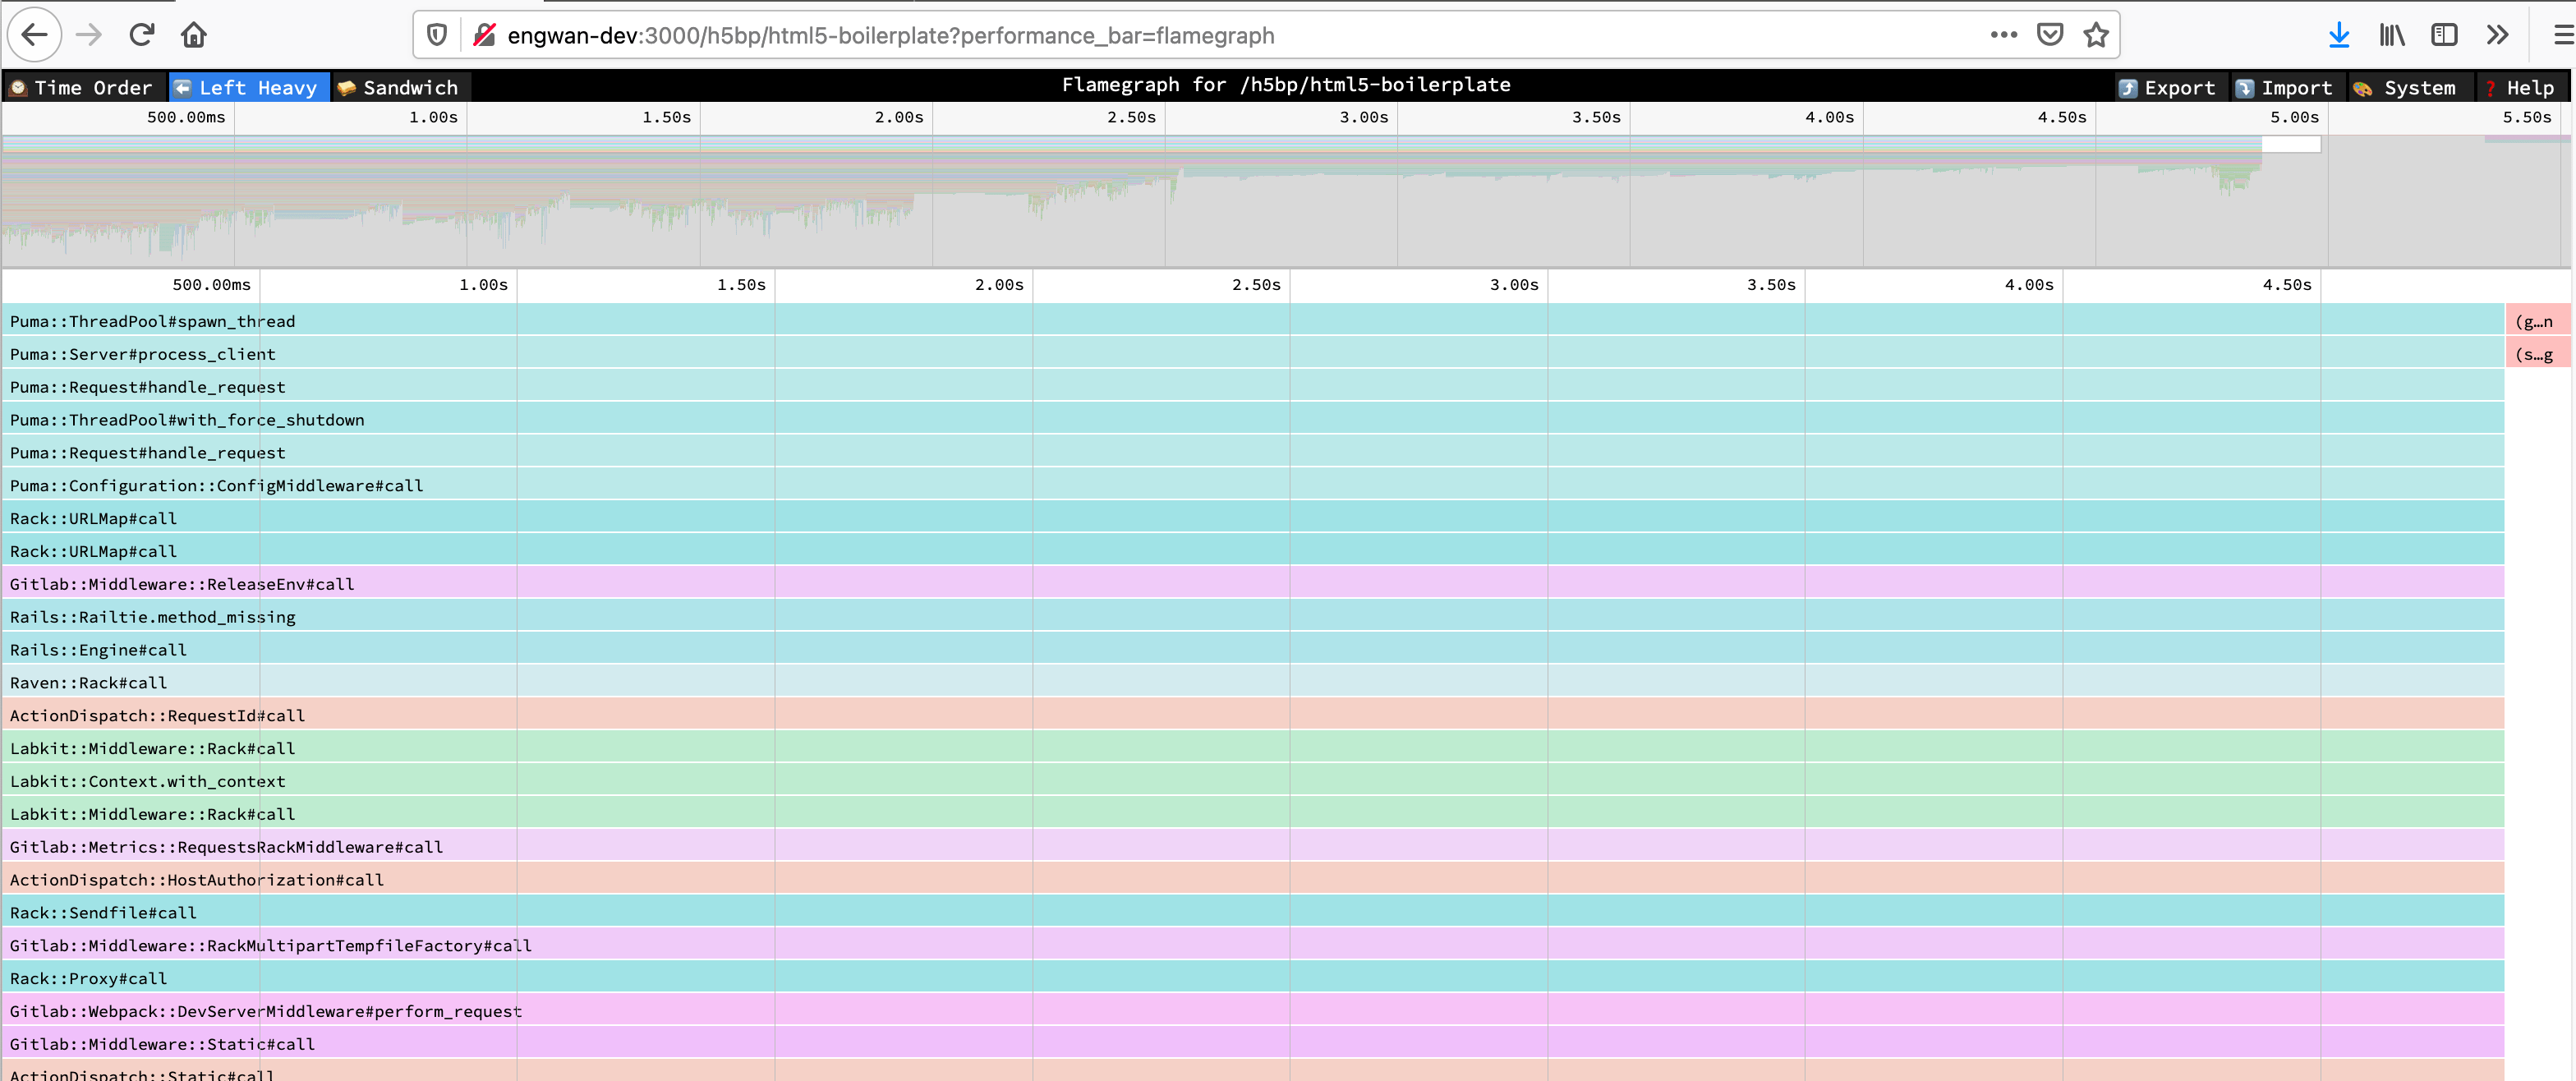
More information about the views can be found in the Speedscope docs
This is enabled for all users that can access the performance bar.
Sherlock
Sherlock is a custom profiling tool built into GitLab. Sherlock is only
available when running GitLab in development mode and when setting the
environment variable ENABLE_SHERLOCK to a non empty value. For example:
ENABLE_SHERLOCK=1 bundle exec rails sSherlock is also available though the GitLab GDK.
Recorded transactions can be found by navigating to /sherlock/transactions.
Bullet
Bullet is a Gem that can be used to track down N+1 query problems. Bullet section is displayed on the performance-bar.
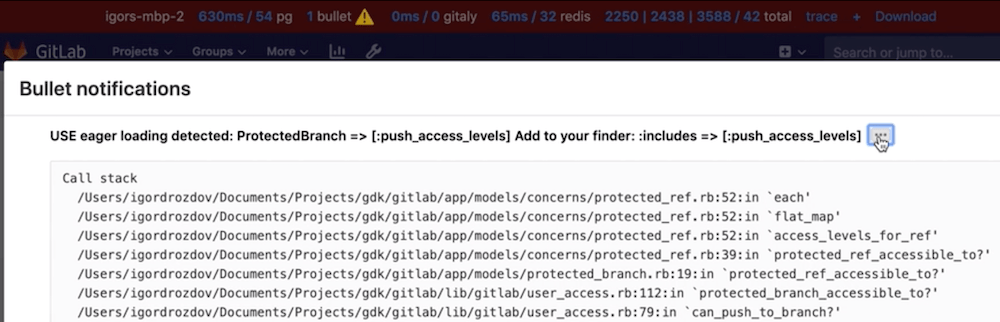
Because Bullet adds quite a bit of logging noise the logging is disabled by default.
To enable the logging, set the environment variable ENABLE_BULLET to a non-empty value before
starting GitLab. For example:
ENABLE_BULLET=true bundle exec rails sBullet logs query problems to both the Rails log as well as the Chrome console.
As a follow up to finding N+1 queries with Bullet, consider writing a QueryRecoder test to prevent a regression.
System stats
During or after profiling, you may want to get detailed information about the Ruby virtual machine process, such as memory consumption, time spent on CPU, or garbage collector statistics. These are easy to produce individually through various tools, but for convenience, a summary endpoint has been added that exports this data as a JSON payload:
curl localhost:3000/-/metrics/system | jqExample output:
{
  "version": "ruby 2.7.2p137 (2020-10-01 revision a8323b79eb) [x86_64-linux-gnu]",
  "gc_stat": {
    "count": 118,
    "heap_allocated_pages": 11503,
    "heap_sorted_length": 11503,
    "heap_allocatable_pages": 0,
    "heap_available_slots": 4688580,
    "heap_live_slots": 3451712,
    "heap_free_slots": 1236868,
    "heap_final_slots": 0,
    "heap_marked_slots": 3451450,
    "heap_eden_pages": 11503,
    "heap_tomb_pages": 0,
    "total_allocated_pages": 11503,
    "total_freed_pages": 0,
    "total_allocated_objects": 32679478,
    "total_freed_objects": 29227766,
    "malloc_increase_bytes": 84760,
    "malloc_increase_bytes_limit": 32883343,
    "minor_gc_count": 88,
    "major_gc_count": 30,
    "compact_count": 0,
    "remembered_wb_unprotected_objects": 114228,
    "remembered_wb_unprotected_objects_limit": 228456,
    "old_objects": 3185330,
    "old_objects_limit": 6370660,
    "oldmalloc_increase_bytes": 21838024,
    "oldmalloc_increase_bytes_limit": 119181499
  },
  "memory_rss": 1326501888,
  "memory_uss": 1048563712,
  "memory_pss": 1139554304,
  "time_cputime": 82.885264633,
  "time_realtime": 1610459445.5579069,
  "time_monotonic": 24001.23145713,
  "worker_id": "puma_0"
}
NOTE: This endpoint is only available for Rails web workers. Sidekiq workers can not be inspected this way.
Settings that impact performance
Application settings
-
developmentenvironment by default works with hot-reloading enabled, this makes Rails to check file changes every request, and create a potential contention lock, as hot reload is single threaded. -
developmentenvironment can load code lazily once the request is fired which results in first request to always be slow.
To disable those features for profiling/benchmarking set the RAILS_PROFILE environment variable to true before starting GitLab. For example when using GDK:
- create a file
env.runitin the root GDK directory - add
export RAILS_PROFILE=trueto yourenv.runitfile - restart GDK with
gdk restart
This environment variable is only applicable for the development mode.
GC settings
Ruby's garbage collector (GC) can be tuned via a variety of environment variables that will directly impact application performance.
The following table lists these variables along with their default values.
| Environment variable | Default value |
|---|---|
RUBY_GC_HEAP_INIT_SLOTS |
10000 |
RUBY_GC_HEAP_FREE_SLOTS |
4096 |
RUBY_GC_HEAP_FREE_SLOTS_MIN_RATIO |
0.20 |
RUBY_GC_HEAP_FREE_SLOTS_GOAL_RATIO |
0.40 |
RUBY_GC_HEAP_FREE_SLOTS_MAX_RATIO |
0.65 |
RUBY_GC_HEAP_GROWTH_FACTOR |
1.8 |
RUBY_GC_HEAP_GROWTH_MAX_SLOTS |
0 (disable) |
RUBY_GC_HEAP_OLDOBJECT_LIMIT_FACTOR |
2.0 |
RUBY_GC_MALLOC_LIMIT(_MIN) |
(16 * 1024 * 1024 /* 16MB */) |
RUBY_GC_MALLOC_LIMIT_MAX |
(32 * 1024 * 1024 /* 32MB */) |
RUBY_GC_MALLOC_LIMIT_GROWTH_FACTOR |
1.4 |
RUBY_GC_OLDMALLOC_LIMIT(_MIN) |
(16 * 1024 * 1024 /* 16MB */) |
RUBY_GC_OLDMALLOC_LIMIT_MAX |
(128 * 1024 * 1024 /* 128MB */) |
RUBY_GC_OLDMALLOC_LIMIT_GROWTH_FACTOR |
1.2 |
(Source)
GitLab may decide to change these settings in order to speed up application performance, lower memory requirements, or both.
You can see how each of these settings affect GC performance, memory use and application start-up time for an idle instance of
GitLab by running the scripts/perf/gc/collect_gc_stats.rb script. It will output GC stats and general timing data to standard
out as CSV.